Exploratory Data Analysis
Contents
Exploratory Data Analysis#
Telling the future is the exciting part of data mining. Everyone wants to build the best model that can be the most accurate prediction of future results or have the best explanation for why the past occurred the way it has. But in order to have a valuable model, it is important to understand the data, determine the shape, understand the predictors and the target variables (if any). Understanding the scale of these values and their relationship to each other can save hours of testing different modelling techniques and parameter tuning.
The next cell is one that will appear in some configuration as the first in nearly every notebook. It imports the key libraries we are going to use in our analysis and model building. In the first case, we will depend on pandas and numpy for our data manipulation and we’ll leverage matplotlib as our graphical library. We’ll also use the seaborn library to show off a few plots and visuals that are not quite as readily accessible with the matplotlib library.
# Import relevant libraries
import pandas as pd
import numpy as np
import matplotlib.pyplot as plt

import seaborn as sns
import sys
sys.path.append('..')
from src.data import load_data

# If you are using a 'light' them
# comment out or remove this line
pd.set_option('display.precision',4)
plt.style.use('dark_background')
Boston Housing Dataset#
Let’s take a look at some basic data manipulation with pandas and understand how to get some data to work with. In all of our examples, we’ll use a pretty standard text format called (CSV) or comma-separated-values files. This format is readable by nearly every statistical software package and by humans. The first row is typically the name of the columns and each line of the file is a row of data with the values separated by commas. The pandas library supports many different ways to load up a dataframe, which we will use as the primary mechanism for manipulating data in these notebooks.
Business Context#
Each record in the database describes a Boston suburb or town. The data was drawn from the Boston Standard Metropolitan Statistical Area (SMSA) in 1970. The attributes are defined as follows (taken from the UCI Machine Learning Repository):
CRIM: per capita crime rate by town
ZN: proportion of residential land zoned for lots over 25,000 sq.ft.
INDUS: proportion of non-retail business acres per town
CHAS: Charles River dummy variable (= 1 if tract bounds river; 0 otherwise)
NOX: nitric oxides concentration (parts per 10 million)
RM: average number of rooms per dwelling
AGE: proportion of owner-occupied units built prior to 1940
DIS: weighted distances to five Boston employment centers
RAD: index of accessibility to radial highways
TAX: full-value property-tax rate per 10,000
PTRATIO: pupil-teacher ratio by town
B: 1000(Bk−0.63)2 where Bk is the proportion of blacks by town
LSTAT: % lower status of the population
MEDV: Median value of owner-occupied homes in 1000s
CAT.MEDV: Is median value of owner-occupied home in tract above $30k (CAT.MEDV = 1) or not (CAT.MEDV = 0)
We can see that the input attributes have a mixture of units.
# Load up the housing dataset
housing_df = load_data('BostonHousing')
housing_df
/workspaces/py4analytics/book/data/BostonHousing.csv
| CRIM | ZN | INDUS | CHAS | NOX | RM | AGE | DIS | RAD | TAX | PTRATIO | LSTAT | MEDV | CAT. MEDV | |
|---|---|---|---|---|---|---|---|---|---|---|---|---|---|---|
| 0 | 0.0063 | 18.0 | 2.31 | 0 | 0.538 | 6.575 | 65.2 | 4.0900 | 1 | 296 | 15.3 | 4.98 | 24.0 | 0 |
| 1 | 0.0273 | 0.0 | 7.07 | 0 | 0.469 | 6.421 | 78.9 | 4.9671 | 2 | 242 | 17.8 | 9.14 | 21.6 | 0 |
| 2 | 0.0273 | 0.0 | 7.07 | 0 | 0.469 | 7.185 | 61.1 | 4.9671 | 2 | 242 | 17.8 | 4.03 | 34.7 | 1 |
| 3 | 0.0324 | 0.0 | 2.18 | 0 | 0.458 | 6.998 | 45.8 | 6.0622 | 3 | 222 | 18.7 | 2.94 | 33.4 | 1 |
| 4 | 0.0691 | 0.0 | 2.18 | 0 | 0.458 | 7.147 | 54.2 | 6.0622 | 3 | 222 | 18.7 | 5.33 | 36.2 | 1 |
| ... | ... | ... | ... | ... | ... | ... | ... | ... | ... | ... | ... | ... | ... | ... |
| 501 | 0.0626 | 0.0 | 11.93 | 0 | 0.573 | 6.593 | 69.1 | 2.4786 | 1 | 273 | 21.0 | 9.67 | 22.4 | 0 |
| 502 | 0.0453 | 0.0 | 11.93 | 0 | 0.573 | 6.120 | 76.7 | 2.2875 | 1 | 273 | 21.0 | 9.08 | 20.6 | 0 |
| 503 | 0.0608 | 0.0 | 11.93 | 0 | 0.573 | 6.976 | 91.0 | 2.1675 | 1 | 273 | 21.0 | 5.64 | 23.9 | 0 |
| 504 | 0.1096 | 0.0 | 11.93 | 0 | 0.573 | 6.794 | 89.3 | 2.3889 | 1 | 273 | 21.0 | 6.48 | 22.0 | 0 |
| 505 | 0.0474 | 0.0 | 11.93 | 0 | 0.573 | 6.030 | 80.8 | 2.5050 | 1 | 273 | 21.0 | 7.88 | 11.9 | 0 |
506 rows × 14 columns
Exploratory Data Analysis (EDA)#
Once we understand the business content, then we want to take a look at our data and see what else we can discover about the relationships between our target variable and the other independent factors.
We’ll end up doing quite a bit of EDA, usually we’ll start with some EDA, clean up the data and munge it into an appropriate format for modeling and then we’ll want to check out the results. It pays to have a good grasp of a plotting library and some techniques to make this process go a bit faster. There are a few libraries which are pretty common place in the data science with python world, including seaborn and matplotlib. Many new libraries have been introduced recently as well that add much more interactive opportunities with less coding.
# Change the column to be more convenient (notice the space between . MEDV)
housing_df.rename(columns={'CAT. MEDV':'CAT_MEDV'},inplace=True)
# Take a look at the first few rows of data
housing_df.head()
| CRIM | ZN | INDUS | CHAS | NOX | RM | AGE | DIS | RAD | TAX | PTRATIO | LSTAT | MEDV | CAT_MEDV | |
|---|---|---|---|---|---|---|---|---|---|---|---|---|---|---|
| 0 | 0.0063 | 18.0 | 2.31 | 0 | 0.538 | 6.575 | 65.2 | 4.0900 | 1 | 296 | 15.3 | 4.98 | 24.0 | 0 |
| 1 | 0.0273 | 0.0 | 7.07 | 0 | 0.469 | 6.421 | 78.9 | 4.9671 | 2 | 242 | 17.8 | 9.14 | 21.6 | 0 |
| 2 | 0.0273 | 0.0 | 7.07 | 0 | 0.469 | 7.185 | 61.1 | 4.9671 | 2 | 242 | 17.8 | 4.03 | 34.7 | 1 |
| 3 | 0.0324 | 0.0 | 2.18 | 0 | 0.458 | 6.998 | 45.8 | 6.0622 | 3 | 222 | 18.7 | 2.94 | 33.4 | 1 |
| 4 | 0.0691 | 0.0 | 2.18 | 0 | 0.458 | 7.147 | 54.2 | 6.0622 | 3 | 222 | 18.7 | 5.33 | 36.2 | 1 |
# check the rows and columns
housing_df.shape
(506, 14)
We see from the ouput about that we have 506 rows and 14 columns, but we can’t see all the columns - let’s check out the column names and get an idea of the some descriptive statistics for each numerical column)
housing_df.describe()
| CRIM | ZN | INDUS | CHAS | NOX | RM | AGE | DIS | RAD | TAX | PTRATIO | LSTAT | MEDV | CAT_MEDV | |
|---|---|---|---|---|---|---|---|---|---|---|---|---|---|---|
| count | 506.0000 | 506.0000 | 506.0000 | 506.0000 | 506.0000 | 506.0000 | 506.0000 | 506.0000 | 506.0000 | 506.0000 | 506.0000 | 506.0000 | 506.0000 | 506.0000 |
| mean | 3.6135 | 11.3636 | 11.1368 | 0.0692 | 0.5547 | 6.2846 | 68.5749 | 3.7950 | 9.5494 | 408.2372 | 18.4555 | 12.6531 | 22.5328 | 0.1660 |
| std | 8.6015 | 23.3225 | 6.8604 | 0.2540 | 0.1159 | 0.7026 | 28.1489 | 2.1057 | 8.7073 | 168.5371 | 2.1649 | 7.1411 | 9.1971 | 0.3725 |
| min | 0.0063 | 0.0000 | 0.4600 | 0.0000 | 0.3850 | 3.5610 | 2.9000 | 1.1296 | 1.0000 | 187.0000 | 12.6000 | 1.7300 | 5.0000 | 0.0000 |
| 25% | 0.0820 | 0.0000 | 5.1900 | 0.0000 | 0.4490 | 5.8855 | 45.0250 | 2.1002 | 4.0000 | 279.0000 | 17.4000 | 6.9500 | 17.0250 | 0.0000 |
| 50% | 0.2565 | 0.0000 | 9.6900 | 0.0000 | 0.5380 | 6.2085 | 77.5000 | 3.2074 | 5.0000 | 330.0000 | 19.0500 | 11.3600 | 21.2000 | 0.0000 |
| 75% | 3.6771 | 12.5000 | 18.1000 | 0.0000 | 0.6240 | 6.6235 | 94.0750 | 5.1884 | 24.0000 | 666.0000 | 20.2000 | 16.9550 | 25.0000 | 0.0000 |
| max | 88.9762 | 100.0000 | 27.7400 | 1.0000 | 0.8710 | 8.7800 | 100.0000 | 12.1265 | 24.0000 | 711.0000 | 22.0000 | 37.9700 | 50.0000 | 1.0000 |
housing_df.dtypes
CRIM        float64
ZN          float64
INDUS       float64
CHAS          int64
NOX         float64
RM          float64
AGE         float64
DIS         float64
RAD           int64
TAX           int64
PTRATIO     float64
LSTAT       float64
MEDV        float64
CAT_MEDV      int64
dtype: object
Now that we have an idea of the numerical fields. We should check out the distribution of the CAT_MEDV field to see how these are laid out.
print (housing_df.value_counts(['CAT_MEDV']))
# and also the percentages
housing_df.value_counts(['CAT_MEDV'])/len(housing_df)
CAT_MEDV
0           422
1            84
dtype: int64
CAT_MEDV
0           0.834
1           0.166
dtype: float64
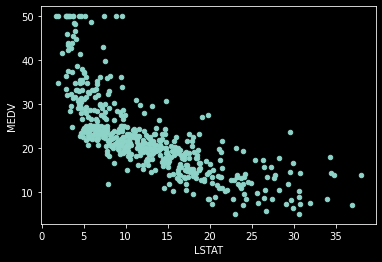
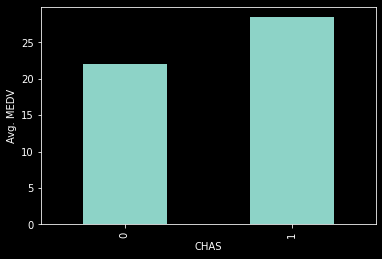
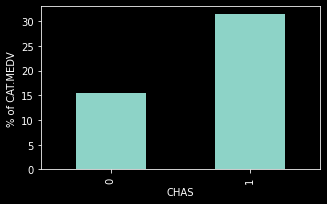
We can now take a look at a couple of values as they relate to our target variable (CAT_MEDV).
housing_df.plot.scatter(x='LSTAT', y='MEDV', legend=False)
<AxesSubplot:xlabel='LSTAT', ylabel='MEDV'>
ax=housing_df.groupby('CHAS').mean().MEDV.plot(kind='bar')
ax.set_ylabel('Avg. MEDV')
Text(0, 0.5, 'Avg. MEDV')
dataForPlot= housing_df.groupby('CHAS').mean()['CAT_MEDV']*100
ax=dataForPlot.plot(kind='bar', figsize=[5,3])
ax.set_ylabel('% of CAT.MEDV')
Text(0, 0.5, '% of CAT.MEDV')
Determining the interaction between a set of variables#
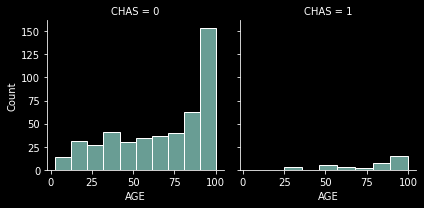
Sometimes it is helpful to see many more dimensions of the data at once. We can use color, size, shape and axises to show several dimensions, and one more commonly overlooked approach is to use faceting as yet another dimension. Let’s take a look at how the age of the houses vary by the relativeness to the Charles river.
From here we can see that, as previously, there are many more homes not on the Charles River and also that the age of the homes is skewed heavily toward the older home ages.
(Check out the extra notebook Visualization Samples to see another library and possible visualizations.)
g = sns.FacetGrid(housing_df, col='CHAS')
g.map_dataframe(sns.histplot,x='AGE')
<seaborn.axisgrid.FacetGrid at 0x7f8980423ca0>
We may also be interested in the relationship between a set of the variables so that we can identify which ones may prove to be over-influencing a regression model. For this we can use two approaches, first we’ll look at a set of charts that are related in a pair-wise chart or a correlation map. First a pairwise graph. A pairwise graph shows the relationship between these 4 different variables to each other in one simple clean chart.
# setup a small subset of data
df = housing_df[['CRIM','INDUS','LSTAT',"RM","MEDV"]]
sns.pairplot(df)
<seaborn.axisgrid.PairGrid at 0x7f8980423d00>
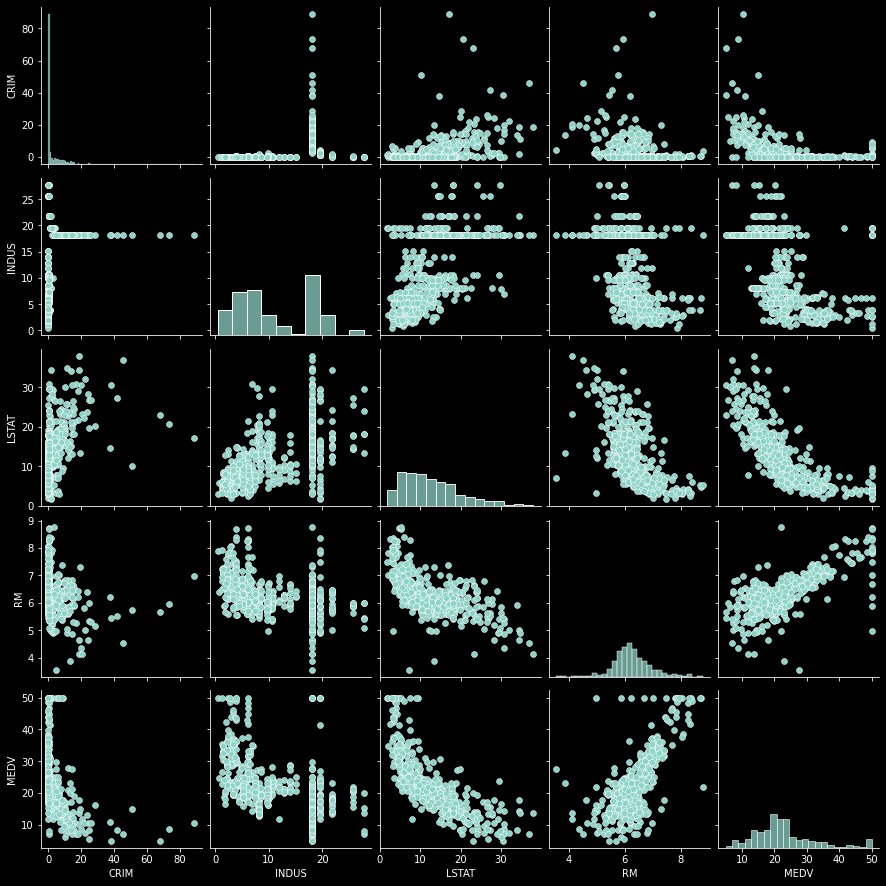
Looking at the pair plots, it seems that we have a very clear relationship between RM and MEDV, an inverse linear relationship between LSAT and RM and also a slightly or maybe non-linear relationship between LSTAT and MEDV.
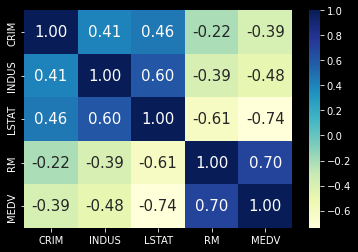
Let’s take a look and see if we can find any correlations
print(housing_df.corr())
sns.heatmap(df.corr(),  fmt='.2f',
    annot=True,
    annot_kws={'size': 15},
    cmap='YlGnBu')
            CRIM      ZN   INDUS    CHAS     NOX      RM     AGE     DIS  \
CRIM      1.0000 -0.2005  0.4066 -0.0559  0.4210 -0.2192  0.3527 -0.3797
ZN       -0.2005  1.0000 -0.5338 -0.0427 -0.5166  0.3120 -0.5695  0.6644
INDUS     0.4066 -0.5338  1.0000  0.0629  0.7637 -0.3917  0.6448 -0.7080
CHAS     -0.0559 -0.0427  0.0629  1.0000  0.0912  0.0913  0.0865 -0.0992
NOX       0.4210 -0.5166  0.7637  0.0912  1.0000 -0.3022  0.7315 -0.7692
RM       -0.2192  0.3120 -0.3917  0.0913 -0.3022  1.0000 -0.2403  0.2052
AGE       0.3527 -0.5695  0.6448  0.0865  0.7315 -0.2403  1.0000 -0.7479
DIS      -0.3797  0.6644 -0.7080 -0.0992 -0.7692  0.2052 -0.7479  1.0000
RAD       0.6255 -0.3119  0.5951 -0.0074  0.6114 -0.2098  0.4560 -0.4946
TAX       0.5828 -0.3146  0.7208 -0.0356  0.6680 -0.2920  0.5065 -0.5344
PTRATIO   0.2899 -0.3917  0.3832 -0.1215  0.1889 -0.3555  0.2615 -0.2325
LSTAT     0.4556 -0.4130  0.6038 -0.0539  0.5909 -0.6138  0.6023 -0.4970
MEDV     -0.3883  0.3604 -0.4837  0.1753 -0.4273  0.6954 -0.3770  0.2499
CAT_MEDV -0.1520  0.3653 -0.3663  0.1086 -0.2325  0.6413 -0.1912  0.1189

             RAD     TAX  PTRATIO   LSTAT    MEDV  CAT_MEDV
CRIM      0.6255  0.5828   0.2899  0.4556 -0.3883   -0.1520
ZN       -0.3119 -0.3146  -0.3917 -0.4130  0.3604    0.3653
INDUS     0.5951  0.7208   0.3832  0.6038 -0.4837   -0.3663
CHAS     -0.0074 -0.0356  -0.1215 -0.0539  0.1753    0.1086
NOX       0.6114  0.6680   0.1889  0.5909 -0.4273   -0.2325
RM       -0.2098 -0.2920  -0.3555 -0.6138  0.6954    0.6413
AGE       0.4560  0.5065   0.2615  0.6023 -0.3770   -0.1912
DIS      -0.4946 -0.5344  -0.2325 -0.4970  0.2499    0.1189
RAD       1.0000  0.9102   0.4647  0.4887 -0.3816   -0.1979
TAX       0.9102  1.0000   0.4609  0.5440 -0.4685   -0.2737
PTRATIO   0.4647  0.4609   1.0000  0.3740 -0.5078   -0.4434
LSTAT     0.4887  0.5440   0.3740  1.0000 -0.7377   -0.4699
MEDV     -0.3816 -0.4685  -0.5078 -0.7377  1.0000    0.7898
CAT_MEDV -0.1979 -0.2737  -0.4434 -0.4699  0.7898    1.0000
<AxesSubplot:>
correlationMatrix = df.corr()
# Convert our correlationMatrix to a one-dimensional array
correlationMatrix = correlationMatrix.unstack()
correlationMatrix[abs(correlationMatrix) > 0.7]
CRIM   CRIM     1.0000
INDUS  INDUS    1.0000
LSTAT  LSTAT    1.0000
       MEDV    -0.7377
RM     RM       1.0000
MEDV   LSTAT   -0.7377
       MEDV     1.0000
dtype: float64
Other datasets that are of interest for EDA#
Amtrack- includes data for timeseries analysisBankruptcy]- lots of factors to considerMotor Vehicle Collisions]- includes lat/long, useful for mapping visuals
Other tools for EDA#
You may find the notebook Other Tools for EDA an interesting tour as well.


